The Real Impact of Visual Product Image Optimization on Meta Campaign Performance

Michaela Vaňková
20. 1. 2026
5 minutes read

Almost everyone knows that on Meta, creative is one of the most important aspects of advertising. Companies experiment with new formats, memes, reactions to current trends, clickbait banners, and even controversial videos. It could be said that creativity in ads on this platform comes in all colors.

Despite this, there is one important and for e‑commerce almost indispensable ad format that is rarely worked with visually: dynamic product ads.

Dynamic Ads

These ads perform extremely well in the middle and lower stages of the marketing funnel, but they come with one major drawback. If you sell products that are identical to those of your competitors, there is little room for creative differentiation. Yes, you can use a dynamic frame, but it is displayed only to a limited extent and only in certain placements.

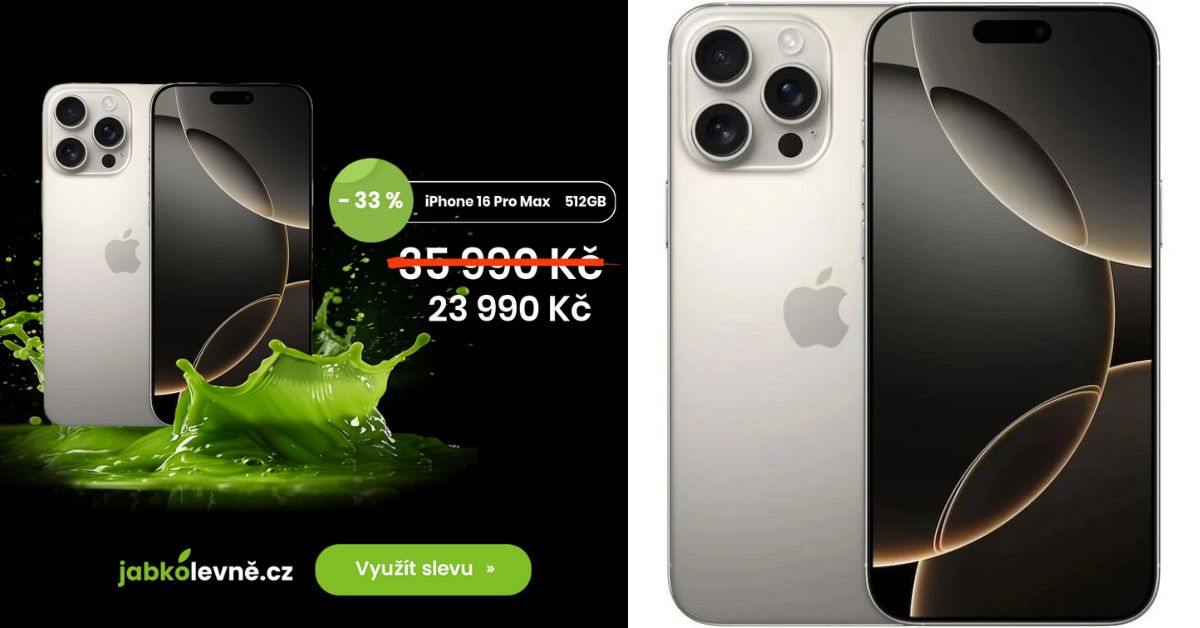
That is why at the Effectix agency we have long been using the external tool Feed Image Editor by Mergado to dynamically optimize product images. This allows us to enhance product images with brand colors, add a logo and CTA, price, discount, or a promotional claim.

Until now, however, we had never tested the real impact of this tool. That has now changed.

Business Model

The test was launched on the JabkoLevně online store.

This is an online store focused on selling used electronics, especially Apple phones, tablets, and computers. The product portfolio is dominated by higher-priced items.

The typical customer is someone who wants a premium product while also preferring a more economically and environmentally friendly alternative to buying a new device. The online store therefore combines a performance-driven offering with an emphasis on trustworthiness, expertise, and long-term customer satisfaction.

A/B Test Setup

An A/B test ran over a five-day period, in which two identical ad sets were tested against each other. They had the same settings, the same budget and schedule, identical ad formats, and copy. We also paid close attention to Advantage+ creative settings. Both ad sets used the same product groups and the same formats (catalog carousel and catalog single image ad).

The only difference was that the first ad set (set A) used a catalog in which product images were modified using the above-mentioned external tool, while the second ad set (set B) used a catalog with the original, unedited images. To ensure the quality of the test, both catalogs were connected to the same dataset and had been collecting data for more than 90 days prior to the test. In other words, aside from the product images, set A was identical to set B.

On the left, the product image in set A (edited image); on the right, the product image in set B (original image).

In the A/B test, we optimized as standard for the number of purchases with a 7‑day click + 1‑day view attribution window, in order to best simulate typical ad behavior. As the tested metrics, we selected both upper-funnel metrics (CPC, cost per engagement, cost per reach) and lower-funnel metrics (add to cart, proceed to checkout).

A/B Test Results

The A/B test clearly identified a winner across all key metrics, with the exception of CPC, namely set A (the variant with edited product images).

Among the “hard” metrics, the strongest difference was observed in the cost per checkout, where set A achieved significantly better efficiency. The cost per checkout in set A was 70.88% lower. The difference is statistically significant at a significance level of α = 0.1, which means the result can be considered statistically robust and highly reliable.

A very similar outcome was observed for the cost per 1,000 users reached, where set A, thanks to a lower CPM, achieved a value 27.23% lower than set B. Here too, the difference is statistically significant at a significance level of α = 0.1, again confirming that this is a real effect rather than a random fluctuation.

For add-to-cart events, the cost in set A was 62.49% lower, again at a significance level of α = 0.1.

Similarly, for the “soft” metric of cost per engagement, set A performed 12.31% better at the same significance level.

The only metric where the A/B test was unable to determine a winner with sufficient confidence was CPC. Although set A again performed better in nominal terms, the p‑value was greater than 0.1, meaning that the hypothesis that the difference is random cannot be rejected with sufficient certainty.

Due to the high price of the products and therefore a high CPA, no clear winner was identified for the purchases metric either, even though set A again performed better in nominal terms.

Overall, however, it is important to emphasize that across all key funnel metrics that most directly impact business outcomes, the A/B test identified a winner. The results are also mutually consistent, which further strengthens the credibility of the conclusions.

The relative differences in results remain unchanged even when evaluating only the first conversion per user, demonstrating that the results are not influenced by highly active “clickers” who repeatedly add and remove items from the cart.

Another very interesting finding is the lower CPM for set A, which confirms higher ad relevance and thus more frequent wins in ad auctions.

Recommendation

Based on the results of the A/B test, we recommend the long-term use of dynamically optimized product images as the standard for dynamic ads. Creative optimization has a demonstrable impact not only on “soft” metrics but, above all, on metrics related to purchase intent, and does so at a statistically supported level of significance. The results also show a high degree of consistency across the entire funnel spectrum, which significantly increases the credibility of the conclusions.

Test Limitations

Although the test results show a high level of statistical support and consistency across metrics, it is important to note several limitations that must be taken into account when interpreting them.

The test was conducted with a sufficient budget, but over a relatively short period of five days, and therefore does not reflect seasonality, users’ price sensitivity over a longer time horizon, or potential changes in audience behavior. As a result, the findings cannot be automatically generalized to all situations or long-term campaign performance without further validation.

Another limitation is that the test was carried out on a specific type of product assortment and a specific brand. Even though the effect is strong and statistically supported, it cannot be ruled out that other product categories or different price ranges may respond differently. Likewise, brands with high brand awareness or a distinctive visual style may experience a different magnitude of effect.

Although both tested ad sets were configured identically and worked with the same dataset and historical signals, it is still necessary to consider that Meta is a probabilistic system that optimizes over time based on internal models that are not fully controllable. Therefore, it is not possible to completely eliminate the influence of algorithmic micro-changes during the test.